Natvis in Visual Studio
When working on the C++ delegates (see previous post), I found out about a thing called “natvis” and I never actually heard of it before even though it’s always been right under my nose when debugging Unreal Engine projects. It’s a really awesome and powerful debugging tool that allows you to define how classes should be visualized in the Visual Studio “Watch” windows and hover windows.
So instead of having to dig through a load of expanders to find what you’re looking for in an object, you can fully customize the window to show only the relevant information of that object. Natvis is a xml-based file that you simply include in your Visual Studio project that Just Works™.
Many of you might already know about this but there’s a small detail that helps you with debugging natvis that you might not know about!
Setup
It’s very easy to setup a natvis file, you create a new .natvis file with the following boilerplate code and include it in your project, the filename is not important. Visual Studio will automatically pick it up and you can have as many as you want.
<?xml version="1.0" encoding="utf-8"?>
<AutoVisualizer xmlns="http://schemas.microsoft.com/vstudio/debugger/natvis/2010">
    <!-- Content goes here -->
</AutoVisualizer>
You can modify the natvis files while debugging and it will update automatically! When you make a mistake, visual studio will always fall back to the default view.
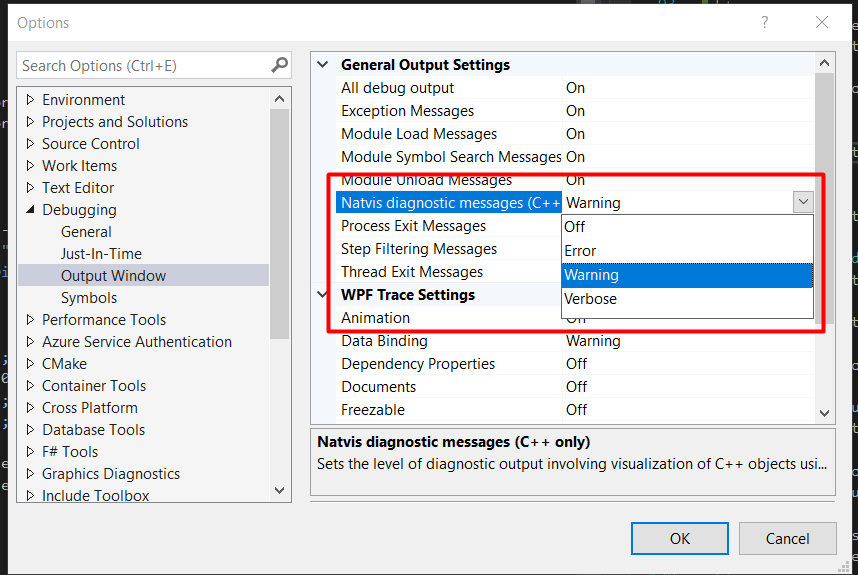
Debugging issues in natvis can be really annoying not knowing there’s an option for the output log to log errors and warnings during debugging. I highly recommend doing this! You can enable this in the Visual Studio options here.
Applying to delegates
I found my delegates a good test case for natvis because it’s not always obvious when a delegate is bound and how it was allocated.
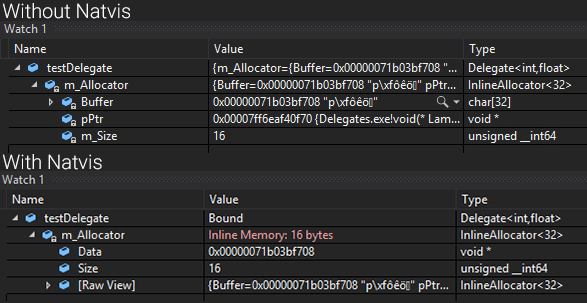
For the Delegates, implementing natvis is quite simple. To achieve the results in the image shown in the beginning, we have to change the way a Delegate<> and an InlineAllocator<> is visualized.
I wanted to easily know when a Delegate was bound or not and if the data of the function it it’s bound to, is allocated dynamically or inline. Interesting to note here, is that we can leverage the fact that MSVC sets uninitialized stack values to 0xcccccccc that way we can distinguish uninitialized values from initialized values.
<Type Name="Delegate<*>">
<DisplayString Condition="m_Allocator.m_Size >= 0xcccccccc">Invalid</DisplayString>
<DisplayString Condition="m_Allocator.m_Size == 0">Unbound</DisplayString>
<DisplayString>Bound</DisplayString>
</Type>
<Type Name="InlineAllocator<*>">
<DisplayString Condition="m_Size >= 0xcccccccc">Invalid</DisplayString>
<DisplayString Condition="m_Size == 0">Unallocated: {m_Size} bytes</DisplayString>
<DisplayString Condition="m_Size > $T1">Dynamic Memory: {m_Size} bytes</DisplayString>
<DisplayString Condition="m_Size <= $T1">Inline Memory: {m_Size} bytes</DisplayString>
<Expand>
<Item Name="Data" Condition="m_Size > $T1">pPtr</Item>
<Item Name="Data" Condition="m_Size <= $T1">(void*)Buffer</Item>
<Item Name="Size">m_Size</Item>
</Expand>
</Type>
In this case, I address all the instances of the Delegate class by using the wildcard '*' in Delegate<*> (notice we’re working in XML here and not use '<' and '>', hence the < and >). This can be “specialized” using explicit types and/or values.
Addressing template values and types is done with the following syntax: $T%idx%. So in this case, I get the first template value (which is the max size of an inline allocation) using $T1. This also works for types if you want to do typecasting. Using the template value, we can figure out if the allocation is inline or dynamic.
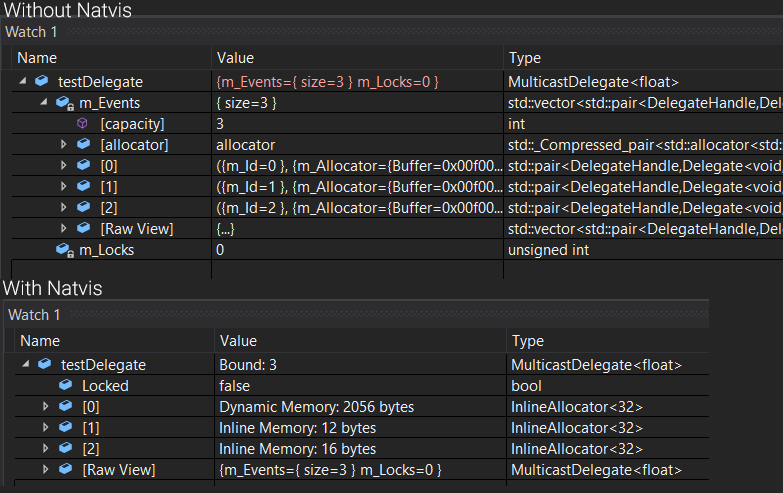
I’ve extended this to work with the MulticastDelegate and what is cool is that because the MulticastDelegate is internally just a list of regular Delegates, expanding the elements, will show each Delegate also using the visualization we’ve setup above. This is where things get a little bit more interesting. You can completely customize the way data is represented using CustomListItems. This allows you to even execute logic to get the data representation you want!
<Type Name="MulticastDelegate<*>">
<DisplayString Condition="m_Locks == 0xcccccccc">Invalid</DisplayString>
<DisplayString Condition="m_Events.size() == 0">Unbound</DisplayString>
<DisplayString>Bound: {m_Events.size()}</DisplayString>
<Expand>
<Item Name="Locked">m_Locks > 0</Item>
<CustomListItems MaxItemsPerView="100">
<Variable Name="i" InitialValue="0" />
<Size>m_Events.size()</Size>
<Loop>
<Item>m_Events[i].second.m_Allocator</Item>
<Exec>i++</Exec>
</Loop>
</CustomListItems>
</Expand>
</Type>
For every Delegate in the list, we’re actually only interested in the InlineAllocator because that shows us all the information I’m interested in.
Below the difference:
More information
You can do much more than the simple example shown above. For example, visualizing non-sequential memory is not straight forward, however there is some great functionality in the natvis framework that help you do this. I highly recommend looking at the syntax reference for more info.